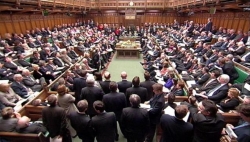
But one thing I absolutely cannot stand is the PMQ’s session that takes place just after a by-election and/or election cycle, where leaders like to claim that the result shows momentum is on their side and that there is actually popular support for their ideas, PMQ’s this week was one of those instances. With the string of by-elections won by Labour, and the Police and Crime Commissioner elections mostly won by the Conservatives, both party leaders decided they could have a go at it. Ed Miliband first claimed that the voters of Corby, the constituency that they won back last week after celebrity candidate Louise Mensch decided to spend more time with her family in New York, spoke for the “whole country”. Never one to miss a slither of good news, David Cameron countered that the voters of Humberside spoke for the “entire nation” in rejecting John Prescott’s campaign; two sides claiming a popular mandate in two very different elections at once.
But of course, both of their claims were proved disingenuous by once thing: the voting figures.
Take Humberside, my home county. The Tories were, understandably, very shocked and relieved to have held onto this area under such difficult circumstances, and you can see why they might have a case to lay claim to a popular mandate, but a cursory look at the official voting figures shows that they achieved a victory but little in the way of a mandate:
HUMBERSIDE: Matthew Grove (Conservative) elected Turnout does not include spoilt ballots
Turnout: 133,762 (19.15%)
Second round
Candidate
Party
Final total
%
Status
Matthew Grove Conservative 42,164 Elected John Prescott Labour 39,933 First round
Candidate
Party
1st pref
%
2nd pref
John Prescott Labour 33,282 24.9% 6,651 Matthew Grove Conservative 29,440 22% 12,724 Paul Davison Independent 28,807 21.5% Godfrey Bloom UKIP 21,484 16.1% Simone Butterworth Liberal Democrat 11,655 8.7% Walter Sweeney Independent 5,118 3.8% Neil Eyre Independent 3,976 3%
Three key tests are worth keeping in mind when reading this result:
- The Turnout: The overall turnout for the Humberside region was just 19%, a figure which still meant the region had the joint-highest turnout nationwide alongside Northamptonshire. A victory can be claimed from such a result, but a “national mandate”?
- The Margin of Victory: Similarly, the margin of victory for the Conservatives was little over 3000 votes. In a constituency of over 900,000 people, this is a victory but not a resounding one.
- The Electoral System: The PCC elections were conducted under what is called the Supplementary Vote System, a non-proportional system whereby votes for the losing candidates can be transferred to the top two candidates if they voters marked one of those two candidates down. Looking at this result you can see that this was what really saved the Conservatives from what would have been margin of defeat as big as their ultimate victory, with the Conservatives picking up over 12,000 mostly transfers from those who voted for UKIP and the independent candidates.
If we now apply these tests to the result of the Corby by-election, held on the same day, we see that some of the same problems emerge:
Corby by-election result
Turnout: 35,733 (44.8%)
Andy Sawford (Lab) 17,267 (48.41%, +9.71%)
Christine Emmett (C) 9,476 (26.57%, -15.63%)
Margot Parker (UKIP) 5,108 (14.32%)
Jill Hope (LD) 1,770 (4.96%, -9.48%)
Gordon Riddell (BNP) 614 (1.72%, -2.93%)
David Wickham (Eng Dem) 432 (1.21%)
Jonathan Hornett (Green) 378 (1.06%)
Ian Gillman (Ind) 212 (0.59%)
Peter Reynolds (Cannabis) 137 (0.38%)
David Bishop (Elvis) 99 (0.28%)
Mr Mozzarella (Ind) 73 (0.20%)
Dr Rohen Kapur (Young) 39 (0.11%)
Adam Lotun (Dem 2015) 35 (0.10%)
Chris Scotton (UPP) 25 (0.07%)
As you can see, the results show the same sorts of problems in claiming that the result spoke for the “whole country”. No matter how you look at it, getting 48% of 44% (21% of all eligible voters for you maths geeks out there), while high in terms of by-elections, is no resounding mandate. Similarly, while the margin of victory is a relatively high 9000 votes, the fact that 52% of this shrunken electorate both failed to get the candidate they wanted and didn’t have any say on the one that ultimately won is depressing to say the least. Looking at it from this perspective, you can see a similar democratic deficit appearing.
But from the world of Westminster and the vantage point of PMQ’s, such facts and figures are quibbles in the way of the most important headline: we won, they lost. I hate PMQ’s not for the people in it but because it reflects one of the basest and most negative aspects of our politics and of human nature more generally, that of argument not to seek out truth and to solve problems but to win as an end in itself. And until we can get away from this mode of debate, I don’t think we can ever truly call ourselves the ‘Mother of Parliaments.’


