Gas: the ‘Putin Tax’ myth
October 6, 2022 9:34 pm Leave your thoughtsArticle by Mark Horner
An earlier article, Oil: the ‘Putin Tax’ myth, debunks as myth the catchphrase ‘Putin Tax’ as relied on by President Biden to, erroneously, identify the cause of the rise in price of US oil and its downstream derivative, gasoline.
The catchphrase is also relied on by Western leaders and mainstream media to identify the cause of the rise in price of EU gas. And so, let’s test their claim.
Testing the claim
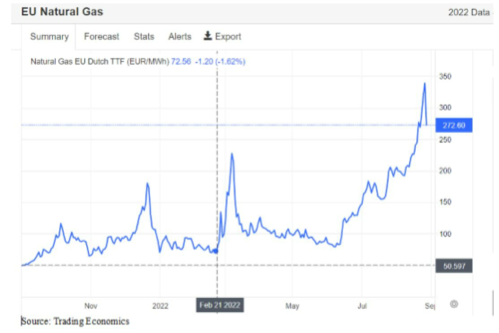
We test the claim by focusing on the movement of the futures market’s price of natural gas. The price is set at a virtual trading point in The Netherlands and is known as the ‘Title Transfer Facility’ (TTF). The test period is the past year, September 2021 to August 2022 and the price is quoted in terms of € per mWh.
The year is split in to three periods: (i) six months before the Ukraine conflict (September 2021 to February 2022), (ii) the first month of the conflict (March 2022) and (iii) the following five months of the conflict (April 2022 to August 2022).
Observing the price movement
In the chart below, first we see that in the six months before the conflict (September 2021 to February 2022), the price has two spikes followed by fall-backs to about the base of each spike. The first spike is 140% (€50 to €120), while the second spike is 80% (€100 to €180).
Second, the Ukraine conflict shocks the market in March 2022 and the price spikes by 230% (€70 to €230).
And third, during the following five months (April 2022 to August 2022), from April 2022 to June 2022 the price falls back by 65% (€230 to €80) to near the pre-conflict price of €70. Then the price reverses and robustly spikes through July and August 2022, rising by 385% (€70 to €340). After which, the price cools by 20% (€340 to €272). Across the year, the price rises 444% (€50 to €272).
Explaining the price movement
In the period August 2021 to February 2022, before the Ukraine conflict, the summer and winter seasonal demand and price peaks of gas are elevated by switching from coal-to-gas which is induced by the EU’s environmental policy to transition away from coal coupled with the macroeconomic driver of the rising price of coal.
However, the fall-backs in the gas price are driven by the EU strategically flipping its environmental policy when market gas supply is low or price is high to increase its consumption of coal. During 2021, EU consumption of coal increased by 17% (International Energy Agency (IEA), 28 July 2022).
In the second period, March 2022, the geopolitical driver of Russia’s military incursion in to Ukraine comes in to play. News of the incursion shocks the gas futures market and spikes the price.
And in the third period, April 2022 to August 2022, there are two contradictory trends. First, the price fall-back from April 2022 to June 2022 is driven by the market observing that the conflict, of itself, is not having an immediate affect on demand or supply of gas. And the fall-back is assisted by the EU continuing to increase consumption of coal, albeit by a smaller increase than in 2021 and trending at about 7% thus far in 2022 (IEA, 28 July 2022).
Then from July 2022 to August 2022, the price robustly spikes yet remains elevated. The primary driver underpinning this trend is the geopolitical response announced by the EU to sanction Russian gas: the EU commits to a policy to reduce imports of Russian gas by two-thirds over the forthcoming year (BBC: Jake Horton & Daniele Pabulum, 27 August 2022). This policy has the effect of creating a niche market for non-sanctioned gas with insufficient supply stoking an elevated price, while inviting gas rationing and continuing increases in coal consumption for the next few years.
And in July 2022, an update on the June 2022 explosion at the US Freeport LNG terminal advises that damage to the terminal will adversely affect supply until late 2022. The terminal supplies about 18% of US exported LNG and thus the damage adversely affects LNG supply to the EU and so supports an elevated price at the TTF.
Concluding remarks
The gas futures price chart shows that the impact of the Russian incursion, of itself, on the price of gas is transitory.
However, the subsequent and persistent elevation of the price since June 2022 is primarily driven by the EU’s policy to sanction Russian gas. Whilst the chart shows that there is a ‘tax’ on gas it also shows that the ‘tax’ stems from EU sanctions.
So, an evidence-based analysis of the ‘Putin Tax’ catchphrase with respect to the price of EU gas shows that it is a myth. It is a political catchphrase which masks the market’s characterization of the ‘tax’: the ‘tax’ is an ‘EU Sanction Tax’.
Categorised in: Uncategorized
This post was written by LPJAdmin